<div class="dashboard-container">
 <div class="heart-rate-card">
  <div class="card-header">
   <div class="title-group">
    <h2>
     Heart Rate
    </h2>
   </div>
   <div class="date-selector">
    <span>
     Dates
     <strong style="font-weight: 500;">
      2026
     </strong>
    </span>
    <i class="fa-solid fa-chevron-down">
    </i>
   </div>
  </div>
  <div class="months-grid">
   <div class="month-col">
    <span>
     Jun
    </span>
   </div>
   <div class="month-col">
    <span>
     Sep
    </span>
   </div>
   <div class="month-col">
    <span>
     Dec
    </span>
   </div>
  </div>
  <div class="chart-wrapper">
   <canvas id="heartRateChart">
   </canvas>
   <div class="glow-indicator" id="glowIndicator" style="position: absolute; left: 0; top: 0; transform: translate3d(0, 0, 0); will-change: transform;">
    <div class="pulse-dot">
    </div>
    <div class="light-cone">
    </div>
    <div class="matrix-value-wrapper">
     <svg class="matrix-num" height="32" viewbox="0 0 70 32" width="70">
      <defs>
       <pattern height="3" id="dotPattern" patternunits="userSpaceOnUse" width="3" x="0" y="0">
        <circle cx="1.5" cy="1.5" fill="#111" r="1.1">
        </circle>
       </pattern>
      </defs>
      <text fill="url(#dotPattern)" font-family="'Geist', sans-serif" font-size="32" font-weight="600" id="dynamicMatrixNumber" letter-spacing="1" x="0" y="26">
       60
      </text>
     </svg>
     <span class="percentage">
      +103%
     </span>
    </div>
   </div>
   <div class="y-axis-label label-top">
    60
   </div>
   <div class="y-axis-label label-bottom">
    60
   </div>
   <div class="x-axis-label">
    12
   </div>
  </div>
  <div class="card-tabs">
   <button class="tab-btn">
    Total
   </button>
   <button class="tab-btn active">
    Focus
   </button>
   <button class="tab-btn">
    Sleep
   </button>
   <button class="tab-btn">
    Mood
   </button>
  </div>
 </div>
 <div class="bottom-nav-container">
  <div class="bottom-nav">
   <button class="nav-item">
    <i class="fa-solid fa-house">
    </i>
   </button>
   <button class="nav-item">
    <i class="fa-solid fa-chart-line">
    </i>
   </button>
   <button class="nav-item style-circle">
    <div class="dashed-circle">
    </div>
   </button>
   <button class="nav-item">
    <i class="fa-regular fa-calendar">
    </i>
   </button>
   <button class="nav-item action-btn active">
    <i class="fa-solid fa-chart-bar">
    </i>
   </button>
  </div>
 </div>
</div>
/* Reset and Base Layout Normalization */
*,
*::before,
*::after {
  box-sizing: border-box;
  margin: 0;
  padding: 0;
}

body {
  background-color: #e5e5e5;
  font-family: 'Geist', sans-serif;
  display: flex;
  justify-content: center;
  align-items: center;
  min-height: 100vh;
  padding: 20px;
}

/* Fluid layout container ensuring responsiveness across desktops and mobile screens */
.dashboard-container {
  width: 100%;
  max-width: 410px;
  /* Exact mobile viewport wrapper dimension centered on desktop screens */
  display: flex;
  flex-direction: column;
  align-items: center;
  gap: 24px;
}

/* Skeuomorphic Glassmorphism Card Frame */
.heart-rate-card {
  background: linear-gradient(145deg, rgba(245, 245, 245, 0.9) 0%, rgba(238, 238, 238, 0.9) 100%);
  border: 1px solid rgba(255, 255, 255, 0.6);
  border-radius: 36px;
  width: 100%;
  padding: 32px 28px 24px 28px;
  box-shadow:
    0 10px 30px rgba(0, 0, 0, 0.04),
    inset 0 1px 2px rgba(255, 255, 255, 0.8);
  position: relative;
  overflow: hidden;
}

/* Header Layout Mechanics */
.card-header {
  display: flex;
  justify-content: space-between;
  align-items: center;
  margin-bottom: 30px;
}

.card-header h2 {
  font-size: 17px;
  font-weight: 500;
  color: #444;
}

.date-selector {
  display: flex;
  align-items: center;
  gap: 6px;
  font-size: 13px;
  color: #999;
  cursor: pointer;
}

.date-selector i {
  font-size: 10px;
  color: #bbb;
}

/* Background Metrics Grid Guidelines */
.months-grid {
  position: absolute;
  top: 90px;
  left: 28px;
  right: 28px;
  bottom: 110px;
  display: flex;
  justify-content: space-between;
  pointer-events: none;
  z-index: 1;
}

.month-col {
  width: 1px;
  height: 100%;
  background: linear-gradient(to bottom, rgba(200, 200, 200, 0.15) 0%, rgba(200, 200, 200, 0.03) 100%);
  position: relative;
}

.month-col span {
  position: absolute;
  top: -24px;
  left: 50%;
  transform: translateX(-50%);
  font-size: 11px;
  color: #aaa;
}

/* Chart Canvas Wrapper Element */
.chart-wrapper {
  position: relative;
  width: 100%;
  height: 240px;
  z-index: 2;
  margin-bottom: 25px;
}

canvas {
  width: 100% !important;
  height: 100% !important;
}

/* Static Y-Axis Guide Labels */
.y-axis-label {
  position: absolute;
  right: 0;
  font-size: 11px;
  color: #999;
  pointer-events: none;
  padding-bottom: 2px;
}

.label-top {
  top: 38%;
  border-bottom: 1px dashed rgba(0, 0, 0, 0.08);
  left: 0;
  text-align: right;
}

.label-bottom {
  top: 67%;
  border-bottom: 1px dashed rgba(0, 0, 0, 0.08);
  left: 0;
  text-align: right;
}

.x-axis-label {
  position: absolute;
  bottom: 15px;
  left: 0;
  font-size: 11px;
  color: #aaa;
}

/* Telemetry indicator absolute parent context wrapper */
.glow-indicator {
  position: absolute;
  display: flex;
  align-items: center;
  pointer-events: none;
  z-index: 10;
}

/* Central anchor point mapping directly on top of the line vector */
.pulse-dot {
  width: 6px;
  height: 6px;
  background-color: #111;
  border-radius: 50%;
  position: absolute;
  left: -3px;
  /* Centering mathematical offset on X-axis */
  top: -3px;
  /* Centering mathematical offset on Y-axis */
  z-index: 3;
  box-shadow: 0 0 8px rgba(0, 0, 0, 0.3);
}

/* Volumetric light cone centered vertically with the chart path line */
.light-cone {
  position: absolute;
  left: -2px;
  top: -25px;
  /* Offset half of height (50px) to lock horizontal baseline symmetry */
  width: 55px;
  height: 50px;
  background: radial-gradient(circle at left, rgba(255, 230, 110, 0.8) 0%, rgba(255, 230, 110, 0) 75%);
  clip-path: polygon(0 50%, 100% 0, 100% 100%, 0 50%);
  z-index: 1;
  transform-origin: left center;
  animation: lightPulse 2s infinite ease-in-out;
}

/* Numeric text metrics layout aligned perfectly into the center point baseline */
.matrix-value-wrapper {
  display: flex;
  flex-direction: column;
  align-items: flex-start;
  position: absolute;
  left: 38px;
  /* Safe clearing distance from the active line edge */
  top: -16px;
  /* Offset half of the layout element boundaries for absolute vertical snap */
  z-index: 2;
}

.matrix-num {
  display: block;
}

.percentage {
  font-size: 10px;
  color: #aaa;
  margin-top: -2px;
  font-weight: 500;
  padding-left: 2px;
}

/* Card Navigation Link Selection Elements */
.card-tabs {
  display: flex;
  justify-content: space-between;
  border-top: 1px solid rgba(0, 0, 0, 0.04);
  padding-top: 18px;
}

.tab-btn {
  background: none;
  border: none;
  font-size: 13px;
  color: #aaa;
  cursor: pointer;
  padding: 6px 12px;
  transition: color 0.2s ease;
  font-weight: 400;
  position: relative;
}

.tab-btn.active {
  color: #111;
  font-weight: 500;
}

.tab-btn.active::after {
  content: '';
  position: absolute;
  bottom: -6px;
  left: 50%;
  transform: translateX(-50%);
  width: 3px;
  height: 3px;
  background-color: #111;
  border-radius: 50%;
}

/* Dock Shell Bottom Navigation Bar Layout Setup */
.bottom-nav-container {
  width: 100%;
  padding: 0 6px;
}

.bottom-nav {
  background-color: rgba(230, 230, 230, 0.85);
  backdrop-filter: blur(20px);
  -webkit-backdrop-filter: blur(20px);
  border: 1px solid rgba(255, 255, 255, 0.7);
  border-radius: 40px;
  display: flex;
  justify-content: space-between;
  align-items: center;
  padding: 8px;
  box-shadow: 0 8px 24px rgba(0, 0, 0, 0.03);
}

.nav-item {
  background: none;
  border: none;
  width: 54px;
  height: 54px;
  border-radius: 50%;
  display: flex;
  justify-content: center;
  align-items: center;
  color: #777;
  font-size: 16px;
  cursor: pointer;
  transition: all 0.25s ease;
  position: relative;
}

.nav-item.active {
  background-color: rgba(255, 255, 255, 0.9);
  color: #111;
  box-shadow: 0 4px 12px rgba(0, 0, 0, 0.02);
}

.nav-item.active::after {
  content: '';
  position: absolute;
  bottom: 6px;
  width: 3px;
  height: 3px;
  background-color: #111;
  border-radius: 50%;
}

.nav-item.style-circle .dashed-circle {
  width: 22px;
  height: 22px;
  border: 1.5px dashed #888;
  border-radius: 50%;
}

.nav-item.action-btn {
  background-color: #222;
  color: #fff;
  box-shadow: 0 4px 15px rgba(0, 0, 0, 0.15);
}

.nav-item.action-btn:hover {
  background-color: #111;
}

/* Pulsing Glow Animation Frame Calculations */
@keyframes lightPulse {

  0%,
  100% {
    opacity: 0.8;
    transform: scale(1);
  }

  50% {
    opacity: 1;
    transform: scale(1.04);
  }
}
(function() {
  // Isolated initialization block to avoid runtime parsing or global scope collisions
  const init = () => {
    const ctx = document.getElementById('heartRateChart');
    const glowIndicator = document.getElementById('glowIndicator');
    const dynamicNumber = document.getElementById('dynamicMatrixNumber');

    // Safeguard clause if elements are missing from the current layout context
    if (!ctx || !glowIndicator || !dynamicNumber) return;

    const chartCtx = ctx.getContext('2d');

    /* Static reference datasets to form subtle geometric background waves */
    const baseline1 = [25, 42, 38, 48, 45, 42, 35, 30, 32, 28];
    const baseline2 = [18, 30, 26, 32, 28, 35, 24, 20, 22, 18];

    /* Shortened to 8 coordinates so that the line ends perfectly right after the Sep grid column line */
    let mainData = [12, 35, 58, 52, 48, 64, 52, 56];

    /* Keep 12 full categories representing months to lock the exact total viewport spacing grid */
    let labels = ['Jan', 'Feb', 'Mar', 'Apr', 'May', 'Jun', 'Jul', 'Aug', 'Sep', 'Oct', 'Nov', 'Dec'];

    const heartRateChart = new Chart(chartCtx, {
      type: 'line',
      data: {
        labels: labels,
        datasets: [{
          label: 'Heart Rate',
          data: mainData,
          borderColor: '#222222',
          borderWidth: 1.75,
          pointRadius: 0,
          pointHoverRadius: 0,
          tension: 0.43,
          fill: false
        }, {
          label: 'Base 1',
          data: baseline1,
          borderColor: 'rgba(0, 0, 0, 0.06)',
          borderWidth: 1.2,
          pointRadius: 0,
          tension: 0.4,
          fill: false
        }, {
          label: 'Base 2',
          data: baseline2,
          borderColor: 'rgba(0, 0, 0, 0.04)',
          borderWidth: 1,
          pointRadius: 0,
          tension: 0.45,
          fill: false
        }]
      },
      options: {
        responsive: true,
        maintainAspectRatio: false,
        /* Suppress default multi-frame render interpolation behaviors */
        animation: false,
        plugins: {
          legend: {
            display: false
          },
          tooltip: {
            enabled: false
          }
        },
        scales: {
          x: {
            display: false,
            /* Bounds management strategy: restrict rendering grid space up to Index 11 (December) */
            min: 'Jan',
            max: 'Dec'
          },
          y: {
            display: false,
            min: 0,
            max: 90
          }
        }
      }
    });

    let cycle = 0;

    function animateHeartbeat() {
      cycle += 0.04; /* Controls the frequency speed coefficient of the waveforms */

      /* 1. Calculate structural micro-oscillations across midsection coordinates */
      for (let i = 1; i < 5; i++) {
        if (i === 3 || i === 4) {
          mainData[i] = mainData[i] + Math.sin(cycle + i) * 0.2;
        }
      }

      /* 2. Physics calibration: Lock base pulse and amplitude to strictly iterate within [40, 80] range */
      const basePulseHeight = 60;
      const amplitude = 12; // 60 - 12 = 48 min, 60 + 12 = 72 max (adds safety threshold within 40-80)

      for (let i = 5; i < mainData.length; i++) {
        mainData[i] = basePulseHeight + Math.sin(cycle + i * 0.5) * amplitude;
      }

      /* 3. Recompute vectors and update vector canvas engine context */
      heartRateChart.update();

      /* 4. Trace absolute target pixel dimensional properties of the ultimate dataset coordinate */
      const meta = heartRateChart.getDatasetMeta(0);
      if (meta.data && meta.data.length > 0) {
        const lastPointIndex = mainData.length - 1;
        const lastPoint = meta.data[lastPointIndex];

        if (lastPoint) {
          /* Shift UI overlay via hardware acceleration mapping coordinates on top of the vector point */
          glowIndicator.style.transform = `translate3d(${lastPoint.x}px, ${lastPoint.y}px, 0)`;

          /* Mutate the SVG text string dynamically matching the active numeric coordinate array state */
          const currentLiveValue = mainData[lastPointIndex];
          dynamicNumber.textContent = Math.round(currentLiveValue);
        }
      }

      requestAnimationFrame(animateHeartbeat);
    }

    /* Execute loop lifecycle processing sequence */
    animateHeartbeat();

    /* App capsule panel nav tab toggle interactions */
    const navItems = document.querySelectorAll('.nav-item:not(.action-btn):not(.style-circle)');
    navItems.forEach(item => {
      item.addEventListener('click', () => {
        const activeItem = document.querySelector('.nav-item.active');
        if (activeItem) activeItem.classList.remove('active');
        item.classList.add('active');
      });
    });
  };

  // Safely verify DOM status rules before parsing the script threadanimateHeartbeat
  if (document.readyState === 'loading') {
    document.addEventListener('DOMContentLoaded', init);
  } else {
    init();
  }
})();
High-Fidelity Telemetry Dashboard — Blog Technical Architecture
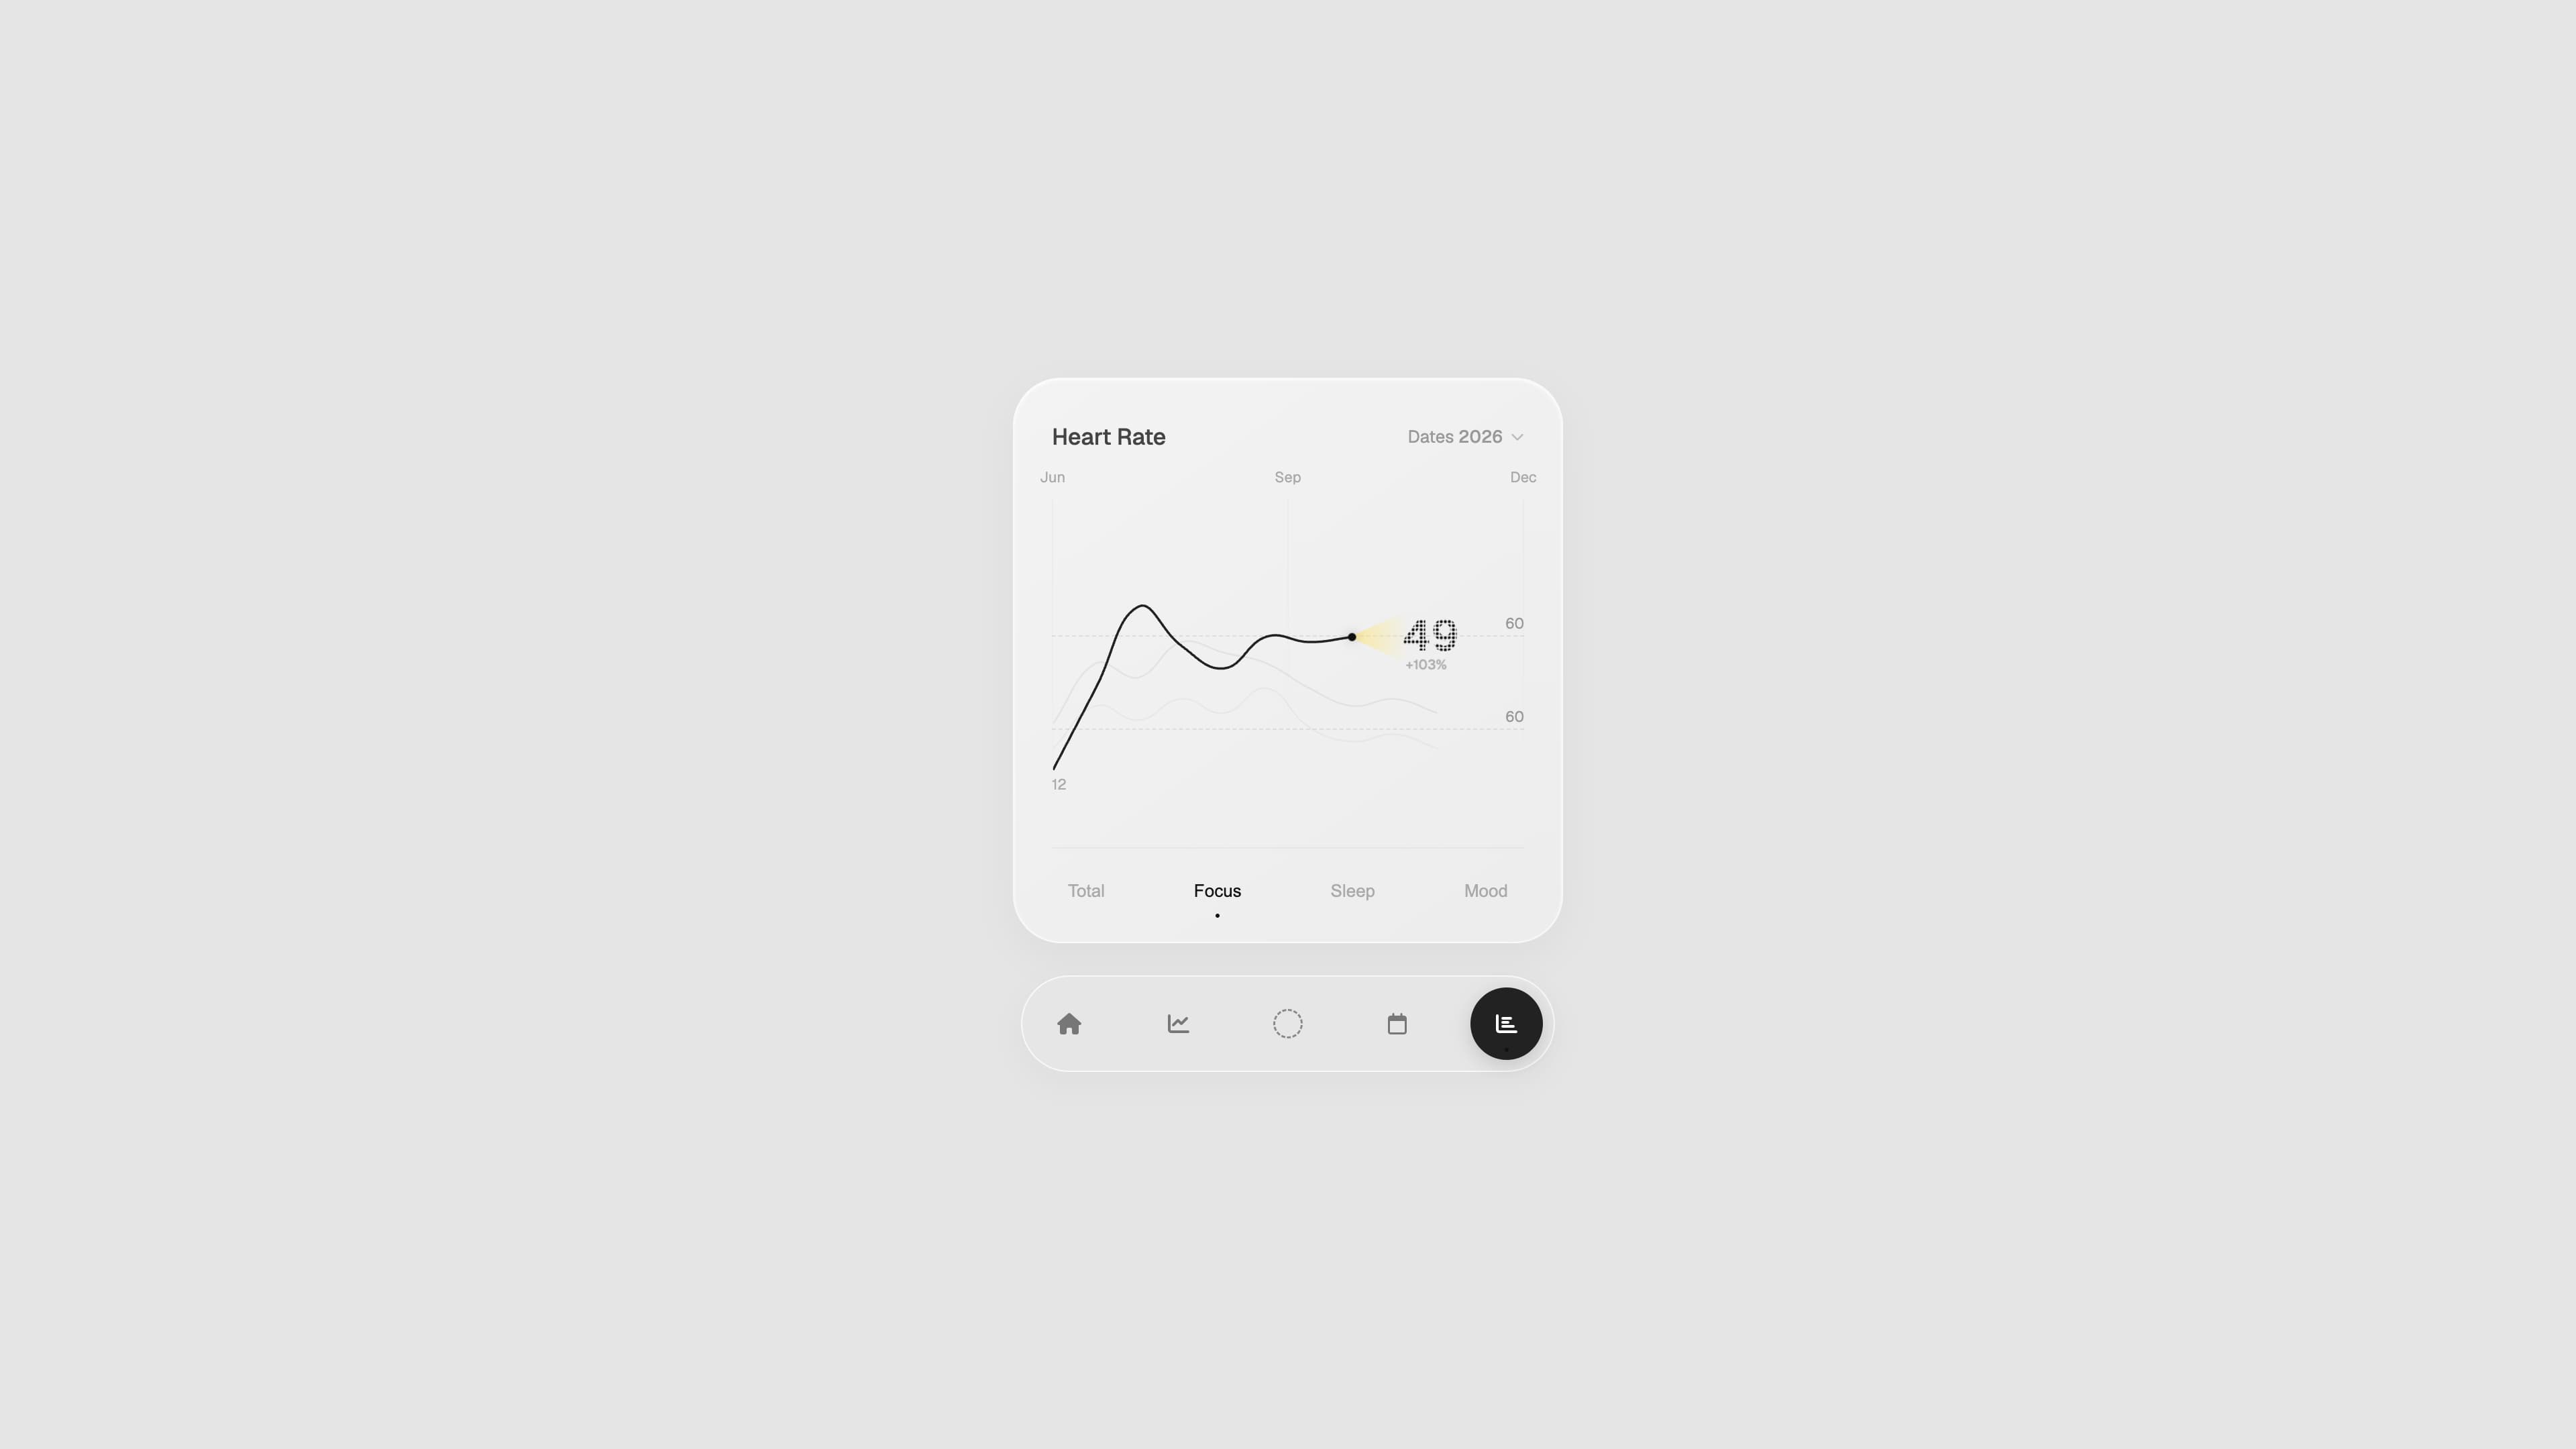
Welcome to the central repository for the production-grade Skeuomorphic Heart Rate UI Component article. This resource is designed as a deep dive tutorial showcasing the intersection of micro-mathematical data models, advanced canvas rendering, and hardware-accelerated interface design.
1. Project Directory Structure
.
├── playground.html_code # Semantically structured HTML layout for the dashboard card and dock
├── playground.css_code # Skeuomorphic glassmorphism styling sheet & hardware animations
├── playground.js_code # Chart.js initialization loop & custom requestAnimationFrame telemetry physics
├── DESIGN.md # Visual rules, token mappings, and layouts for future sections
├── README.md # Article architecture, documentation index, and onboarding guides
└── SKILLS.md # Technical competence matrix for automated engineering agents
2. Core Technological Architecture
The application is engineered around three decoupled layers to optimize client-side execution threads and maintain 60 FPS:
A. Data Layer (Mathematical Physics Loop)
The underlying system relies on an isolated dataset array containing precise month steps. Rather than requesting bulk data or executing jerky visual redraws, the terminal coordinates undergo a smooth mathematical calculation powered by continuous sine wave metrics inside a requestAnimationFrame lifecycle.
B. Presentation Layer (Chart.js Canvas Engine)
A custom instance of a Chart.js line configuration manages the rendering workspace. Global settings (such as tooltips, native interaction grids, and default cross-frame animations) are completely bypassed to ensure that custom overlay elements can be seamlessly integrated on top without layout conflicts.
C. Interactive Overlay (Dynamic SVG Mapping)
The high-fidelity indicator wrapper is injected onto the DOM as an absolute element. By hooking directly into the pixel-mapping engine of the canvas, the tracking element maps its 3D translation states directly over the final dataset coordinate, while mutating raw string values inside the SVG <text> elements in real-time.
3. Article Roadmap & Core Learning Milestones
- Skeuomorphic Architecture Principles: Crafting layered glass textures using alpha borders and complex CSS gradients.
- Chart.js Core Overhaul: Tuning rendering boundaries, locking coordinate indexes, and configuring smooth drawing paths.
- Real-Time Data Mutators: Writing a custom frame loop using mathematical algorithms (
Math.sin()) to generate real-time metrics.
- Flawless Element Overlaying: Reading absolute spatial rendering coordinates out of custom components and binding overlay positions instantly.
- Dynamic Text Engineering: Injecting text mutations directly into vector graphic layouts without causing full document reflows.
Interactive Telemetry Dashboard — Design System & Engineering Specification
This document codifies the visual guidelines, spatial layouts, and motion mechanics of the Telemetry Dashboard system. Adhering to these strict standards ensures that any newly introduced sections (e.g., Sleep, Mood, Total) maintain absolute fidelity, visual weight, and geometric synchronization with the core execution thread.
1. Core Visual Foundations
A. Color Palette & Depth Layering
The design utilizes a desaturated, high-premium skeuomorphic glassmorphism stack that relies on physical alpha-blending instead of flat solid surfaces.
| Layer Component |
Value / Definition |
Purpose |
| Canvas Background |
#e5e5e5 |
Neutral, high-contrast structural anchor plate. |
| Card Surface Base |
linear-gradient(145deg, rgba(245,245,245,0.9), rgba(238,238,238,0.9)) |
Fluid glass sheet that shifts based on directional vectors. |
| Specular Border Rim |
1px solid rgba(255, 255, 255, 0.6) |
Outer micro-bevel edge reflecting ambient layout lighting. |
| Primary Vector Stroke |
#222222 (Charcoal Black) |
Active chart line and bold numerical matrix indicators. |
| Subtle Metrics / Text |
#aaa / #999 |
Muted background text labels and secondary status dots. |
| Volumetric Accent |
radial-gradient(circle at left, rgba(255,230,110,0.8), rgba(255,230,110,0)) |
Soft Canary Yellow light projection for telemetry focus. |
B. Typography & Font Scale Mapping
- Font Family:
'Geist', -apple-system, sans-serif (Strict geometric sans-serif configuration).
- Card Header Title (
h2): Size 17px | Weight 500 | Color #444.
- Static Grid Labels / Axis Strings: Size
11px | Weight 400 | Color #aaa to #999.
- Live Numerical Value Text: Size
32px | Weight 600 | Letter Spacing 1px (Rendered via SVG dot-pattern masks).
2. Component Layout & Structural Geometry
A. Spatial Box Constraints
Every card element MUST follow a strict linear, single-column configuration to guarantee flawless cross-platform performance (A4 PDF boundaries or 410px mobile screen viewports):
[Header Box] Title Text (Left) Selector (Right)
[Months Grid] Floating Month Headers (Jun, Sep, Dec)
[Chart Box] Canvas Context Render Block
===> Active Line Path Vector ===* [Glow]
[Tabs Anchor] Total | Focus* | Sleep | Mood
B. Background Grid Guidelines
- Vertical guides must be positioned absolutely behind the interactive canvas layer using a
linear-gradient to smoothly fade out down the Y-axis.
- Horizontal lines representing thresholds (e.g., the
60 BPM guideline markers) use a border-bottom: 1px dashed rgba(0, 0, 0, 0.08). They must span the full inline width of the container while text tags remain anchored to the margins.
3. Motion & Animation Mechanics
When adding tracking overlays to new charts, engineers must respect the following core mechanics:
A. Hardware-Accelerated Tracking
Never mutate left or top CSS style properties within high-frequency rendering loops. You MUST extract target pixel values out of the internal metadata array of Chart.js (getDatasetMeta(0)) and pipe them into the DOM layout using explicit 3D matrices:
transform: translate3d(lastPoint.x + "px", lastPoint.y + "px", 0);
will-change: transform;
B. Volumetric Volts & Cone Constraints
- Origin Locking: The volumetric light cone element (
.light-cone) must possess a strict transform-origin: left center property.
- Animation Bounds: Do NOT inject directional translations (like
translateY(-50%)) into the continuous pulsing @keyframes loops. Doing so overrides the JavaScript coordinate map and pushes elements out of their true geometric layout positions. Scale factors must strictly vary between 1.0 and 1.04 with subtle alpha transitions to prevent visual stuttering.
C. Coherent Data Bounds (Value Smoothing)
Any custom metric loop must declare clear thresholds to avoid breaking the card layouts. For standard metrics, follow these exact equations:
* Baseline Level (basePulseHeight): Set a steady median index (e.g., 60).
* Max Wave Height (amplitude): Bound variance using strict multipliers (e.g., 12) so that values oscillate gracefully within safe limits without overflowing the canvas height.
Technical Competency Matrix (SKILLS.md) — Autonomous UI Engineering Agent
This specification profiles the specialized skills, algorithmic knowledge, and technical competencies required for an automated developer agent to manage, scale, or rewrite the Interactive Telemetry Dashboard system.
1. Domain Mastery Matrix
Core UI Architecture & Skeuomorphism
- High-Fidelity Glassmorphic Composition: Deep experience implementing complex alpha overlays, specularity mechanics, and custom depth structures using CSS layering techniques (
box-shadow, inset, linear-gradient, rgba()).
- Viewport Boundary Guarding: Expert understanding of layout calculation patterns (
box-sizing: border-box, fluid percent wrappers, max-width anchors) to ensure components display perfectly across environments without layout shifts.
Advanced Data Visualization Engineering
- Chart.js Core Mastery: Complete understanding of the Chart.js internal engine lifecycle, including metadata coordinate parsing (
getDatasetMeta()), manual dataset pipeline adjustments, and disabling default animations to unlock high-frequency performance.
- Strict Scale & Index Optimization: Ability to control data array lengths and match them to visible scale indexes to position telemetry lines exactly where desired.
High-Performance Motion Design & Animation
- Thread Decoupling and Frame Management: Expert implementation of smooth rendering loops via
requestAnimationFrame(), avoiding performance bottlenecks by separating high-frequency math calculations from DOM rendering.
- Hardware-Accelerated Layout Positioning: Proficiency in moving active indicators using 3D rendering profiles (
translate3d, will-change: transform), preventing full-page document reflows.
- Dynamic Vector Graphic Engineering: Experience creating interactive vector graphics with advanced styling filters, dot patterns, and programmatic text updates (
textContent element injection).
2. Core Execution Instructions & Prompt Engineering Guidelines
When commanding automated developer agents to build or scale additional modules within this repository, prompts MUST match the following instruction structure:
- Context Definition:
- Target Objective: Create an isolated visualization component for [Insert Section Name: e.g., Sleep, Mood].
-
Target Blueprint: Align with the desaturated skeuomorphic design guidelines codified in DESIGN.md.
-
Strict Constraints:
- Layout Architecture: Keep elements contained within a single fluid wrapper. Never use structural flex configurations on the outer canvas elements.
- Scale Allocation: Map input arrays to exact chart buckets. Ensure the line endpoints rest precisely between the specified month markers.
-
Value Bound Processing: Ensure numbers stay bounded within safe limits by writing explicit equations to control the amplitude.
-
Performance Directives:
- DOM Updates: Prevent text mutations from causing document reflows by updating the data directly within the SVG layouts.
- Coordinate Mapping: Never use absolute positioning helpers like 'left' or 'top' within performance loops. Read the exact canvas pixels and move elements using 'translate3d'.